San Diego isn’t moving as one big market anymore. In 2026, some neighborhoods are heating up quietly while others are cooling off. Same city. Same week. Totally different leverage.
Get Your FREE Customized Neighborhood Report
Want a ZIP-level breakdown like the 92129 example below? Text your ZIP code to George at 619-846-1244. I’ll send you a clear snapshot of pricing, demand, speed of market, and where leverage is shifting.
Most people only watch prices. That’s like checking the scoreboard without watching the game. If you want to get ahead of trend changes (and likely appreciation pressure), watch these instead:
1) Active vs Pending: If pending homes rise faster than actives, demand is strengthening. If actives pile up, buyers gain leverage.
2) Days on Market (DOM): Under ~30 days tends to mean strong demand. After ~30 days, negotiation pressure usually increases.
3) “Failed to Sell” rate: Expired/withdrawn/cancelled listings show where pricing and positioning are getting punished (and where opportunities appear).
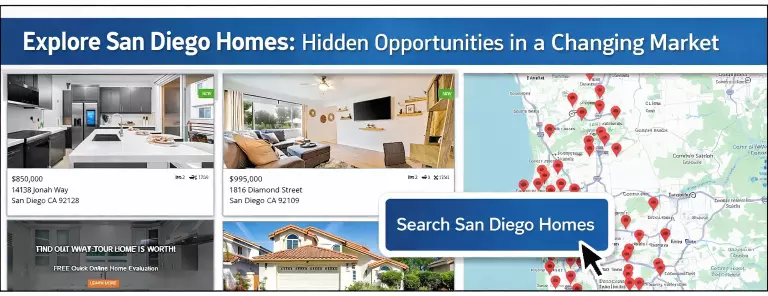
Want the hottest vs coldest neighborhoods plus a quick home search by area and price range (no login)?
Free, Customized report for your zip code. Call or text George at 619-846-1244.
Here’s the kind of ZIP-level clarity most people never see in one place:
Market Outcomes (90 days)
93 homes came to market
33 sold
14 in escrow
27 active
19 failed (expired/withdrawn/cancelled)
20.43% failed-to-sell rate
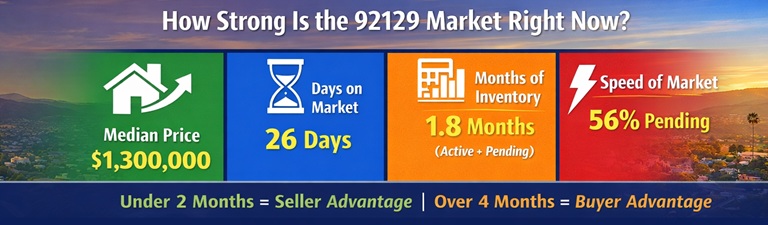
Speed + Supply
Pending vs Active: 14 ÷ 27 = 52%
Sales pace: 33 sold / 90 days ˜ 11 per month
Months of inventory at sales pace: 2.45 months
Monthly absorption vs active: ~41%
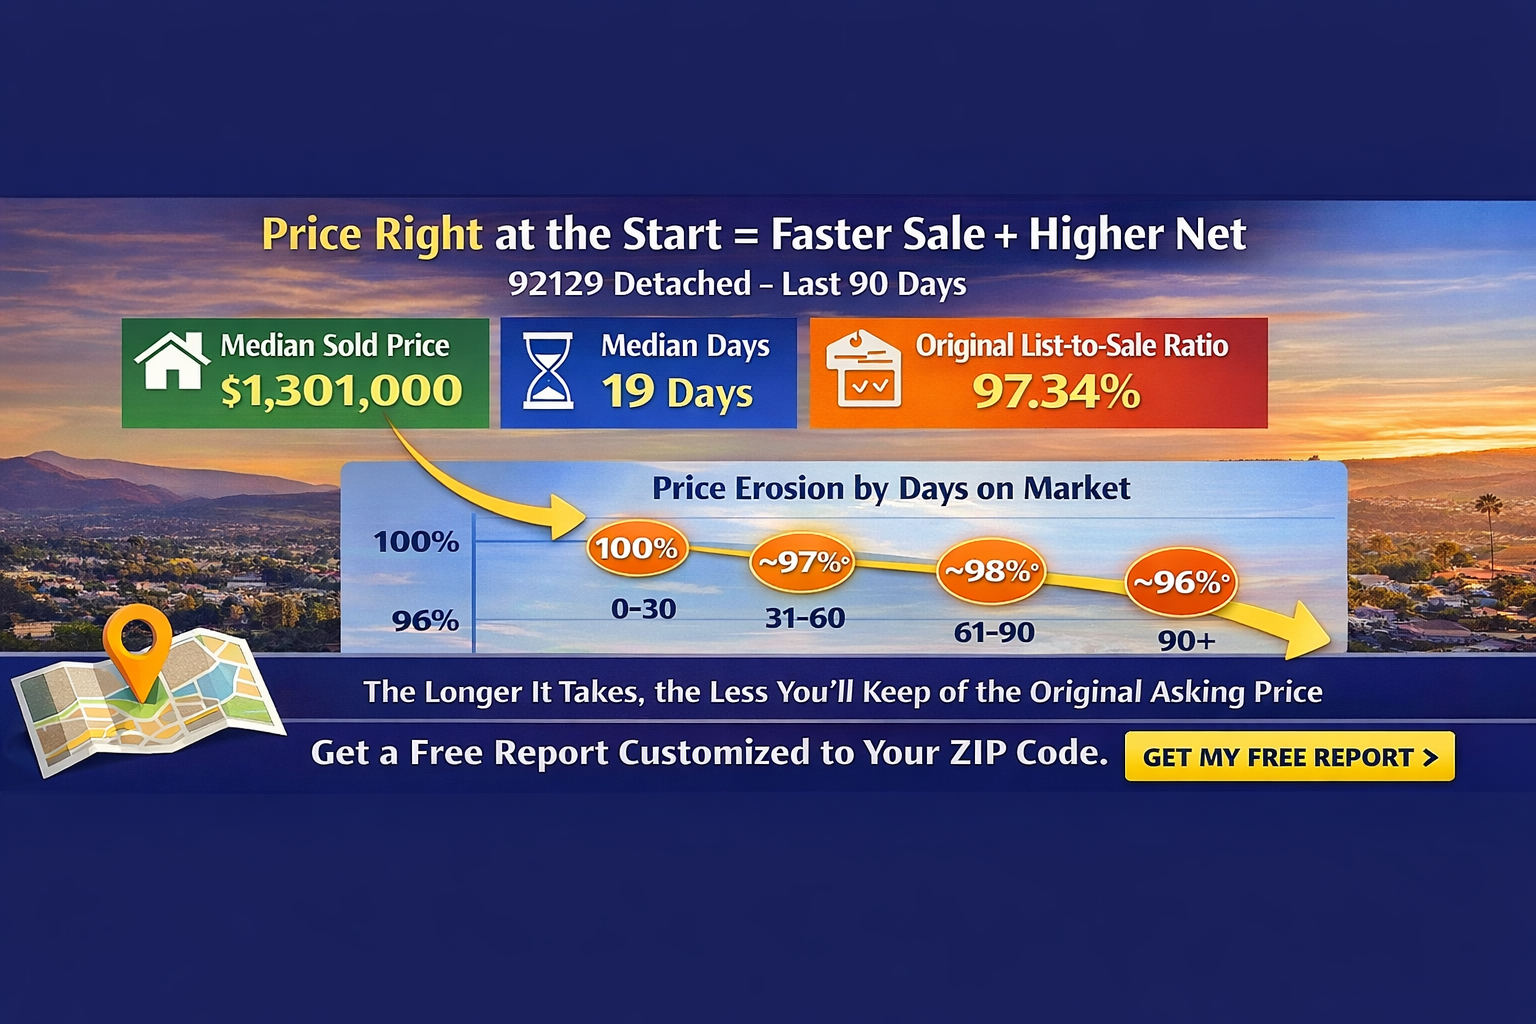
Sold Performance (Detached)
Median sold price: $1,301,000
Median days on market: 19 days
Median list-to-sale ratio: 99.27%
The “30-Day Rule”: Price Erosion Starts After a Home Sits
In 92129 detached homes, the data shows a clear pattern: the longer a home takes to sell, the less of the original asking price it typically keeps.
Sold in 0–30 days: median 100% of original list price
Sold in 31–60 days: median 96.98% of original list price
Sold in 90+ days: median 96.02% of original list price
Translation: pricing and positioning early matters. The market “votes” fast. If it doesn’t get traction, buyers usually demand a discount.
“Hot” neighborhoods usually show up as: low months of inventory, rising pending activity, shorter DOM, and fewer failed listings. “Deal” zones appear where inventory builds, DOM stretches, and sellers start offering credits or price cuts.
Property type matters too. In many areas, detached homes hold pricing power better, while some condos/townhomes can offer more negotiation room (credits, rate buydowns, price reductions). The best move is to compare the property types inside your exact neighborhood — not the county average.
Quick 60-Second Video
Prefer a quick visual breakdown? Watch this short video and then text me your ZIP for a free neighborhood report.
Want a FREE report like this for your neighborhood?
I’ll run your ZIP and send you a clear snapshot: pricing, demand, speed, inventory, and which micro-areas are heating up or cooling off.
We would like to hear from you! If you have any questions, please do not hesitate to contact us. We are always looking forward to hearing from you! We will do our best to reply to you within 24 hours !
In 30 Seconds Your Market Value Get Cash Offer
Cash Offer at Market Value
Learn more
Find out about the "Real Estate Catch-22", and how you can avoid major stress when selling your home.